| Microsoft Office Excel 2007 Tutorial » PivotTable PivotChart » PivotChart |
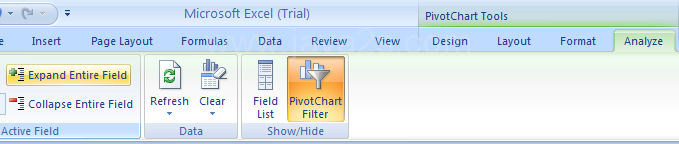
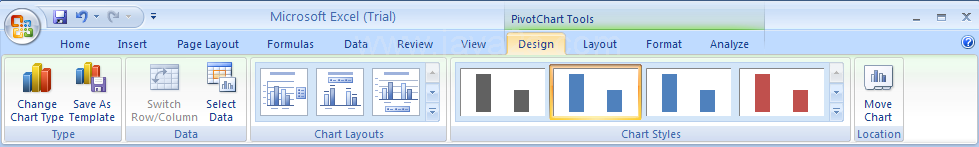
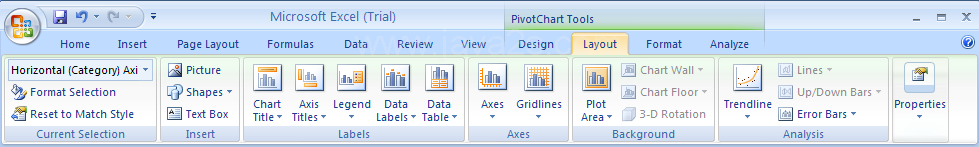
| 9.1.5.Modify a PivotChart Report | |
| |
 | |
| |
 | |
| |
 | |
| |
 | |
| |
 |
| 9.1.PivotChart | ||||
| 9.1.1. | Create a PivotChart Report from a PivotTable Report | |||
| 9.1.2. | Delete a PivotChart | |||
| 9.1.3. | Rename a PivotChart | |||
| 9.1.4. | Rename a field in a PivotChart | |||
| 9.1.5. | Modify a PivotChart Report | |||
| 9.1.6. | Refresh PivotChart | |||