Animate Chart Elements : Chart « Chart Table « Microsoft Office PowerPoint 2007 Tutorial

Home
Microsoft Office PowerPoint 2007 Tutorial
1.Introduction
2.Editing Format
3.Slides
4.Chart Table
5.WordArt Picture Clip Art Shape
6.Add ins Macro ActiveX
VBA / Excel / Access / Word
Microsoft Office Excel 2007 Tutorial
Microsoft Office Word 2007 Tutorial
Microsoft Office PowerPoint 2007 Tutorial » Chart Table » Chart 
4.1.18.Animate Chart Elements
Select the chart. 
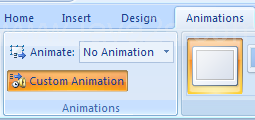
       Click the Animations tab, and then click the Custom Animation button.
Select the chart. Click the Animations tab, and then click the Custom Animation button.
Click Add Effect, point to a category, 
       and then choose an effect from the animation list.
Click Add Effect, point to a category, and then choose an effect from the animation list.
In the Animation Order list, 
       click the list arrow of the animation, and then click Effect Options.
In the Animation Order list, click the list arrow of the animation, and then click Effect Options.
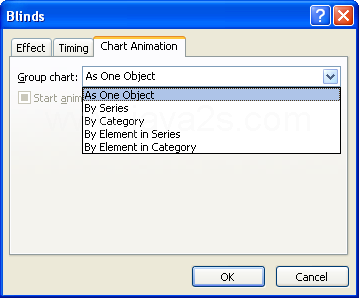
Click the Chart Animation tab, 
       click the Group Chart list arrow, and then click the order.
Click the Chart Animation tab, click the Group Chart list arrow, and then click the order.
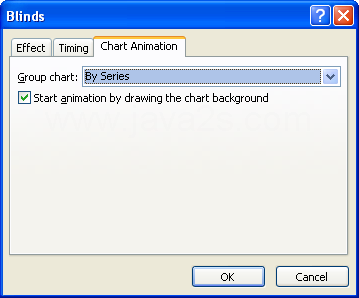
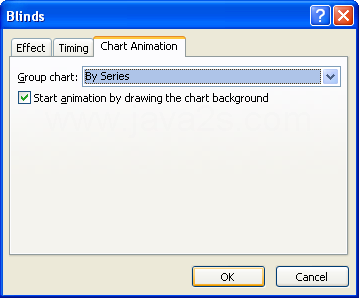
Select the Animate Grid And Legend check box to animate the chart grid and legend.
Select the Animate Grid And Legend check box to animate the chart grid and legend.
Click OK, and then click Play to see the animation effect.
Click OK, and then click Play to see the animation effect.
4.1.Chart
4.1.1.Insert and Create a ChartInsert and Create a Chart
4.1.2.Open and View Chart DataOpen and View Chart Data
4.1.3.Create a chart from a slide layoutCreate a chart from a slide layout
4.1.4.Change a Chart TypeChange a Chart Type
4.1.5.Reset chart formattingReset chart formatting
4.1.6.Apply a Chart LayoutApply a Chart Layout
4.1.7.Apply a Chart StyleApply a Chart Style
4.1.8.Select a Chart ObjectSelect a Chart Object
4.1.9.Change a Chart Object StyleChange a Chart Object Style
4.1.10.Apply a Shape Styles to a Chart ObjectApply a Shape Styles to a Chart Object
4.1.11.Change Chart LabelsChange Chart Labels
4.1.12.Insert a picture into a chartInsert a picture into a chart
4.1.13.Insert a shape into a chartInsert a shape into a chart
4.1.14.Change Chart AxisChange Chart Axis
4.1.15.Change Chart BackgroundChange Chart Background
4.1.16.Create a Custom Chart TemplateCreate a Custom Chart Template
4.1.17.Apply a Chart TemplateApply a Chart Template
4.1.18.Animate Chart ElementsAnimate Chart Elements
www.java2java.com | Contact Us
Copyright 2009 - 12 Demo Source and Support. All rights reserved.
All other trademarks are property of their respective owners.